Data-Driven Event Planning: Using Analytics for Better Engagement
- by GlobalMeet Blog Team
- ,
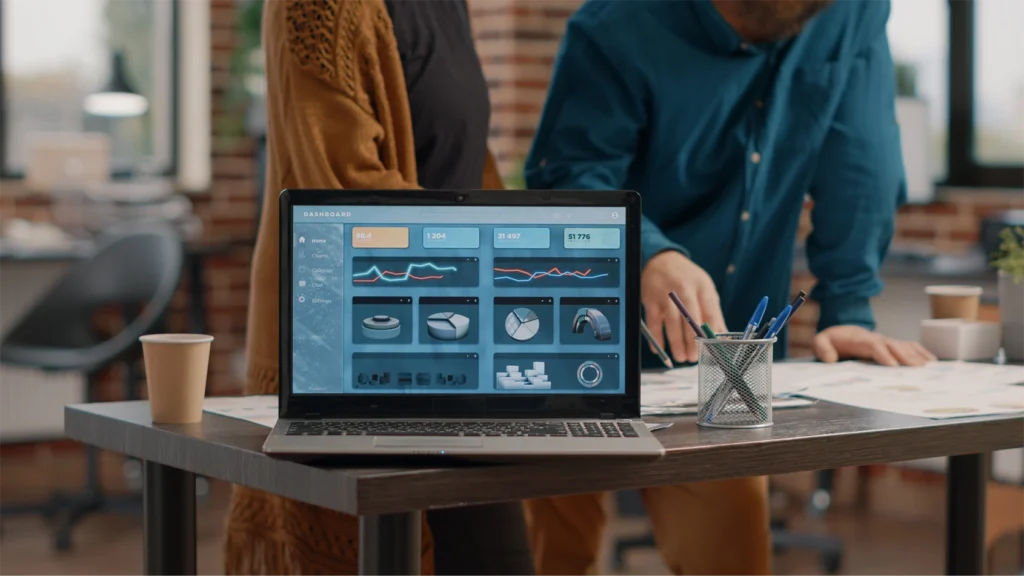
In the age of digital transformation, where every click, comment, and connection are trackable, event planning has entered a new era. Gone are the days when event success was gauged by gut instinct and post-event applause. Today, data-driven event planning is redefining how organizers design, deliver, and evaluate events — particularly in the fast-evolving world of virtual events. With the right approach to event analytics, planners can turn raw data into meaningful insights that drive engagement, improve attendee satisfaction, and optimize outcomes.
Why Data Matters in Event Planning
Events — whether conferences, webcasts, trade shows, or networking sessions — are rich with data. Every registrant, login, and question asked contributes to a digital footprint that tells a story. When captured and analyzed effectively, this data becomes a strategic asset that can significantly improve event management by providing detailed insights into consumer behavior, which in turn enhances marketing strategies and operational efficiency.1
Data helps event planners:
- Understand attendee behavior
- Identify which sessions resonate most
- Pinpoint drop-off points during virtual events
- Tailor content and communication to audience preferences
- Make smarter decisions for future events
This depth of insight available from every single event is a powerful tool for continuous improvement, with real time analytics allowing for dynamic adjustments during events to give participants more meaningful experiences. After the event, post event data enables trend analysis that can feed into future strategic decision-making, and higher return on investment with every subsequent event.
The Shift from Intuition to Analytics
Traditionally, event planning leaned heavily on experience, anecdotal feedback, and post-event surveys. Despite 90% of event planners and marketers reporting that they still use surveys to measure the satisfaction of participants, 19% still report that they do not know their ROI for events.
While these survey inputs are valuable, they are no longer sufficient on their own. The shift to data-driven decision making represents a fundamental change in how events are planned and measured.
Instead of simply asking “Did people enjoy the keynote?”, the collection of qualitative data allows planners to explore trends in more detail. Collecting data on such items as how many attendees watched a keynote, how long they watched, how many engaged with polls or Q&As, and how they scored the session as it closed, enables the creation of measurable metrics that can be used to track improvement in every event.
An analytical approach helps organizations move from assumption to evidence, facilitating continuous improvement and allowing for better resource allocation overall.
Key Event Metrics to Track
Understanding which metrics matter most is the first step in creating a data-driven event strategy that will allow you to learn as your events grow. Creating an overarching data framework for all events where every metric is tracked and analyzed facilitates continuous improvement, with better knowledge exchange between past and future events alleviating uncertainty.2
Below are some of the most critical metrics to monitor, especially for virtual and hybrid events.
Engagement Rates
Engagement is the heartbeat of a successful event. In virtual environments, where distractions are high and attention spans short, tracking how attendees interact is essential. Common engagement indicators include:
- Chat and Q&A participation
- Poll response rates
- Number of virtual session attendances
- Social media shares and mentions
- Participation in gamification segments
High engagement suggests that content is relevant, the format is effective, and the audience is invested. Whilst low engagement provides metrics on which to improve for future events.
Session Attendance
Tracking which sessions attendees join — and for how long — offers insight into content relevance and scheduling effectiveness. Look for:
- Total session attendees
- Peak concurrent attendance
- Session drop-off rates
- Re-watch numbers for recorded sessions
These metrics can inform future content curation, and can help identify which topics or speakers drive the most interest from a target audience.
Audience Retention
Retention metrics show how well an event holds attendee attention. For example, a 60 minute session with an average watch time of 15 minutes may signal a need for a shorter format or more dynamic content delivery style.
Tracking retention can also help organize segment attendees by interest or engagement level, which opens the door to dynamic and post-event personalization.
Feedback and Sentiment
Quantitative metrics are powerful, but qualitative data — like attendee feedback — adds essential context to the mass of numbers. Gathering real-time feedback via surveys, live polls, or post-event questionnaires helps you:
- Understand attendee satisfaction
- Identify pain points
- Highlight what worked well
- Capture improvement suggestions
Some advanced platforms also use AI-driven sentiment analysis to evaluate tone and emotion in written feedback or chat logs.
Combining both data sets for meaningful analysis gives you the best insight possible into your audience, and how to better reach them.
Tools for Data-Driven Event Management
Today, state-of-the-art event technology offers a variety of platforms and tools designed specifically to capture and analyze the data that matters most to your organization at every stage of the event lifecycle.
Event Management Platforms
Specialized bespoke event management platforms are going from strength to strength when it comes to capturing and managing your event data.
Tools like GlobalMeet not only integrate into existing CRM systems, but also offer a suite of built-in analytics dashboards that track:
- Registration and attendance data
- Engagement metrics
- Conversion rates
By utilizing a powerful platform with good CRM integration, event data not only informs future events, but allows for cross collaboration between teams for broader business growth.
Audience Engagement Tools
Platforms that contain or integrate with interactive elements are an excellent resource for collecting analytics on participation rates and audience engagement. A poll, quiz, or Q&A might be easy to overlook on the surface, but the data that they provide are invaluable for understanding your audience, and connecting on a deeper level.
Marketing and CRM Integrations
Connecting event data with tools like HubSpot or Salesforce allows event planners to:
- Track attendee behavior across channels
- Score leads based on engagement
- Trigger personalized follow-ups based on session attendance or pole responses
And with many CRM systems allowing for process automation, event planners can save valuable time by making the best use of them.
AI and Predictive Analytics
Some platforms are beginning to use AI to:
- Predict which sessions will have the highest attendance
- Recommend personalized content to attendees
- Suggest optimal timing and formats based on historical data
This technology adds another layer of analytics information, helping planners stay ahead of audience expectations and mitigate potential issues before they arise.
Personalization Strategies Based on Attendee Data
One of the biggest advantages of data-driven event planning is the ability to create personalized experiences for every attendee. Rather than taking a one-size-fits-all approach, data allows planners to segment their audiences and tailor content accordingly.
Before the Event
Use registration data and past engagement history to:
- Recommend sessions or tracks
- Personalize event communications
- Match attendees with relevant networking opportunities
During the Event
Real-time engagement data enables:
- Dynamic content delivery (e.g., pop-up polls or suggested sessions)
- Customized agendas based on behavior
- Adaptive push notifications and reminders
After the Event
Post-event, data enables:
- Personalized thank-you emails
- Targeted follow-up based on session attendance
- Lead scoring for sales teams based on engagement levels
By making attendees feel seen and understood, personalization enhances satisfaction and increases the likelihood of repeat attendance.
Conclusion
As virtual and hybrid events become more sophisticated, the use of event analytics is no longer optional — it’s a competitive necessity. Planners who embrace data-driven strategies will be better equipped to:
- Prove ROI to stakeholders
- Fine-tune their content and delivery
- Create memorable experiences that resonate with their audience
Ultimately, data empowers event planners to move from reactive to proactive, from general to personalized, and from guesswork to precision. As event technology continues to evolve, the opportunities to deepen engagement through analytics will only grow.
-
Gajdošík, T. 2019. Big Data Analytics in Smart Tourism Destinations. A New Tool for Destination Management Organizations? Springer Proceedings in Business and Economics, 15–33.
-
Müller, M. 2015. The Mega-Event Syndrome: Why So Much Goes Wrong in Mega-Event Planning and What to Do About It. Journal of the American Planning Association, 81(1), 6–17.


